
News
Author of Bombshell Report: COVID Shots Kill 1 Person Per 800 Injections
“When you apply that number to the world – with the billions of injections that have been given – that’s how you get the 17 million (+- 0.5 million) deaths.”

This article originally appeared on soniaelijah.substack.com and was republished with permission.
Guest post by Sonia Elijah
Denis Rancourt, PhD, has written over 100 papers and has held post-doctoral research positions at prestigious institutions in France and The Netherlands, before being a physics professor and lead scientist at the University of Ottawa for 23 years.
On September 17, the non-profit, CORRELATION, published a report, co-authored by Rancourt, entitled ‘COVID-19 vaccine-associated mortality in the Southern Hemisphere.’
The paper is based on the data from 17 countries in the Southern Hemisphere and equatorial region. The researchers found a causal link between many peaks in all-cause mortality and vaccine rollouts. The authors were able to quantify the fatal toxicity risk per injection, which dramatically increased for the elderly.
Furthermore, the authors stated in their paper:
‘We quantify the overall all-ages vDFR [vaccine dose fatality rate] for the 17 countries to be (0.126 ± 0.004) %, which would imply 17.0 ± 0.5 million COVID-19 vaccine deaths worldwide, from 13.50 billion injections up to 2 September 2023. This would correspond to a mass iatrogenic event that killed (0.213 ± 0.006) % of the world population (1 death per 470 living persons, in less than 3 years), and did not measurably prevent any deaths.’
An extract of my interview with Rancourt can be read below.
SE: Why focus on the Southern Hemisphere?
DR: What’s interesting about the Southern Hemisphere is that when the COVID-19 boosters are rolled out (pretty much synchronously around the world) it happens to be the Southern Hemisphere’s summer (January-February), which is our winter. All of a sudden, there’s a sharp peak right at the time where historically there’s always been trough in all-cause-mortality (ACM)- it’s unambiguous that something is happening there.
So, we picked all equatorial regions and SH countries that had data available and we saw every time a booster was rolled out, there was a synchronous peak in the all-cause-mortality and so we reported on it.
SE: Why did you go for ACM?
DR: The reason for that is that you’re just counting deaths irrespective of what anyone would attribute of that death to. In other words, if I am just counting deaths then I know the number is going to be accurate. You do away with all uncertainties and the political bias in assigning a cause of death. When you see an anomaly compared to the historic trend you know that something happened. Then you look at its association in time with other events that the same population is subjected to.
SE: Could you tell us more about the high-quality data you found in Chile and Peru?
DR: We show what actually happens by age-group in Chile and Peru and so when you look at a given age group where you have high quality data, you see it’s very clear when the boosters are rolled out. It’s done very quickly to a given age group, so it’s a sharp peak in time. Immediately following, is a very large peak in ACM- a sudden rise in ACM, which is temporally directly associated with it.
Then you quantify the data- you count the excess deaths within that peak that is directly associated with this rollout and what you found is those deaths on a per injection basis of the booster increase exponentially with the age of the age-group. So the older the people, the greater the risk of dying [from the vaccine] and the bigger that peak in mortality is and it’s exponential. So, every additional 4-5 years in age, the risk of dying per injection doubles!
When you get into the 90+ [age group] in Chile and Peru for the fourth dose, then you get into the risk of 1 death for every 20 injections.
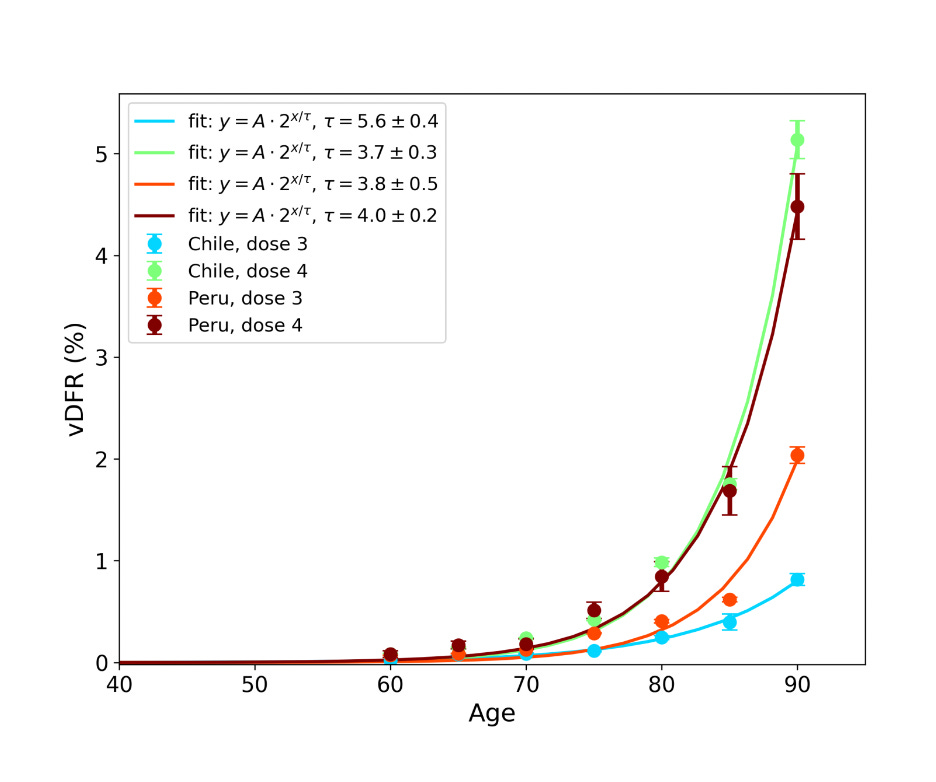
Source: Rancourt et al. 2023, page 102
What we concluded from this- was that the public government policies around the world where you’re supposed to privilege the elderly to be injected because you want to protect them more- is contrary to what you should be doing given that the risk of dying from the injection increases so dramatically with age. We called for this policy to be halted immediately until appropriate clinical studies are done because there are no clinical studies that specifically look at the risks from the vaccine per age group- they didn’t do that. And of course, the elderly always have comorbidities and no clinical studies were done to examine that.
The result is that on an all-ages basis, across the world if you do an average- there is one death per every 800 injections approximately.
How did we get to the 17 million deaths [caused by the vaccine]?
These 17 countries are on 4 continents, which used every kind of COVID-19 vaccine that was produced and applied to their entire population. In other words, our data on these 17 countries is representative of the kind of thing that was happening in the world. It represents 10% of the world population, 9% of all the injections that were given around the globe. We feel that whatever we get from these 17 countries is going to be a fair representation of what occurred in the world.
Then, if you do the sum of all deaths in these 17 countries and ask how many of these deaths can be attributed to the vaccine? What is the excess mortality directly associated in time with vaccination?..We add them all up for the 17 countries and say those deaths are associated with how many injections and when you divide the 2 numbers, you can find the vaccine dose fatality rate– how many deaths will occur per injection. That number is fairly precise- it’s 0.126% and that is the number which corresponds to 1 death per 800 injections. When you apply that number to the world- with the billions of injections that have been given- that’s how you get the 17 million (+- 0.5 million) deaths.


Pfizer to Sell Drugs Online to Consumers, Bypassing Doctors and Pharmacies

State Department Hiding Documents That “Credibly Suggest” COVID Lab Leak: House Investigators

OBGYN Doctor Calls on Attorneys to Sue Institutions That Forced COVID Shots on Babies & Pregnant Women

Georgia Court Agrees to Review Trump’s Appeal to Disqualify Fani Willis from Case

“Joe Rogan Was Right”: Former CNN Anchor Reveals He Takes Ivermectin for ‘Long COVID’

Why Are Newscasters Passing Out? Dr. Peter McCullough Explains

New Bombshell Evidence Reveals US Officials Knew COVID Leaked From Wuhan Lab Back in July 2020

End of an Era: Boy Scouts of America Officially Changes Name to Embrace Inclusivity After 114 Years

AstraZeneca Withdraws COVID-19 Vaccine Globally After Admitting Deaths

Dr. McCullough Issues Chilling COVID Vaccine Forecast

The Hidden Forces Behind the Anti-Israel Protests at Columbia University

Here We Go: Two New COVID Variants Named ‘FLiRT’ Spreading Across U.S.

Over 1,000 US Soldiers “Being Held HOSTAGE” in Niger – Matt Gaetz Releases Shocking Report

Young Boy Dies of Cardiac Arrest in Pfizer Gene Therapy Trial

Former Clinton Adviser Now Says “It’s an Honor” to Be Quoted by Infowars

Trump Classified Documents Trial Postponed Indefinitely After Jack Smith Admits to Evidence Tampering

Elon Musk Wins the Day With Epic Defense of President Trump

Gain-of-Function: Chinese Scientists Create Mutant Ebola Virus in Disturbing Experiment
“Joe Rogan Was Right”: Former CNN Anchor Reveals He Takes Ivermectin for ‘Long COVID’
Why Are Newscasters Passing Out? Dr. Peter McCullough Explains

RFK Jr. Exposes How NIH Profits from COVID Vaccines

Trump Calls Out Biden White House Political Lawfare Outside Courthouse
Dr. McCullough Issues Chilling COVID Vaccine Forecast

Facebook Deleted This Film About Robert Kennedy Jr.

Gun Miraculously Jams as Man Tries to Shoot Pastor During Sunday Sermon in Pennsylvania Church
Elon Musk Wins the Day With Epic Defense of President Trump

Former CNN Anchor Shocks the World With His COVID Vaccine Secret
-
 Health2 days ago
Dr. McCullough Issues Chilling COVID Vaccine Forecast
-
 Featured3 days ago
The Hidden Forces Behind the Anti-Israel Protests at Columbia University
-
 Health2 days ago
Here We Go: Two New COVID Variants Named ‘FLiRT’ Spreading Across U.S.
-
 News2 days ago
Over 1,000 US Soldiers “Being Held HOSTAGE” in Niger – Matt Gaetz Releases Shocking Report